
Top 7 JavaScript Chart Libraries for High-Performance Data Visualization
Modern web applications often need more than simple line charts or static dashboard widgets. Financial interfaces, analytics products, monitoring tools, IoT dashboards, and scientific software all rely on charts that can stay usable under pressure. Once datasets grow or updates happen in real time, chart performance becomes part of the product experience. A slow chart can make an otherwise solid application feel broken. That makes chart selection a technical decision, not just a visual one.
This comparison looks at JavaScript chart libraries through the lens of speed, rendering approach, chart variety, customization, documentation, and production use. Some libraries are better for simple dashboards, while others are built for demanding visualization work. The right choice depends on what the product needs now and what it may need later. To keep the comparison useful, each option is judged by the same core criteria:
- Performance with large datasets and frequent updates;
- Breadth of chart types for complex product needs;
- Flexibility for custom interactions, styling, and workflows;
- Documentation, examples, and developer experience;
- Fit for real production environments, not only demos.
The list starts with the best match for demanding JavaScript visualization, then moves through other tools that suit different dashboard and product needs.
1. SciChart
SciChart is a JavaScript charting library for applications that need fast rendering, advanced visuals, and stable behavior with large or live datasets.
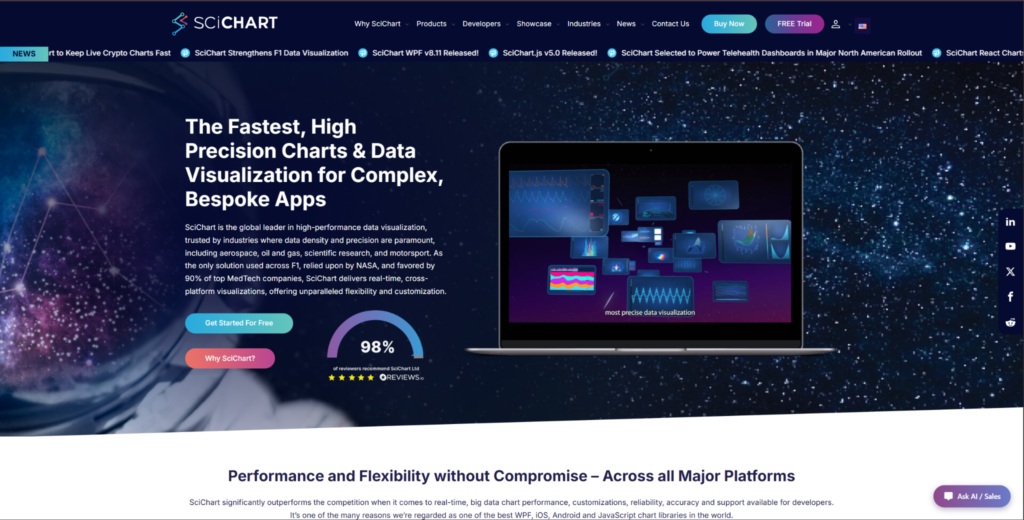
The SciChart JavaScript chart library is built for browser-based visualization, where standard chart tools can struggle with scale, interactivity, or real-time updates. It is especially relevant for financial platforms, scientific tools, engineering software, medical products, and monitoring interfaces. These are cases where chart lag is not just annoying, but directly affects how useful the product feels. SciChart is not the obvious pick for every small dashboard. Its value is clearest when speed, advanced chart types, and heavy interaction matter more than choosing the simplest free option.
SciChart handles very large datasets in the browser and is designed for demanding rendering scenarios. It supports real-time charts, zooming, panning, annotations, and detailed user interaction. That makes it useful for products where charts are not just decorative UI blocks, but a central part of the workflow. The main reasons to consider SciChart are tied to scale, visual range, and production support:
- Handles large datasets and frequent updates in browser-based applications;
- Supports 2D charts, 3D charts, heatmaps, gauges, polar charts, and other advanced visuals;
- Gives developers room to build custom interactions, styling, annotations, and chart behavior;
- Provides extensive demos, examples, documentation, and implementation support;
- Suits commercial products where chart performance is part of the user experience.
SciChart is not the most natural choice for a basic internal dashboard with a few static charts. The commercial license also matters, especially for teams comparing it with open-source libraries. But when a product needs smooth interaction, heavy rendering, and long-term reliability, that tradeoff becomes easier to justify.
SciChart suits engineering teams, product managers, and software companies building chart-heavy products where delays, lag, or limited chart types would hurt the user experience. It can be too much for small static dashboards. For this specific list, it deserves the first place because the focus is on high-performance JavaScript data visualization, not general charting.
2. Highcharts
Highcharts is a mature JavaScript charting library used for polished, interactive charts with broad browser support.
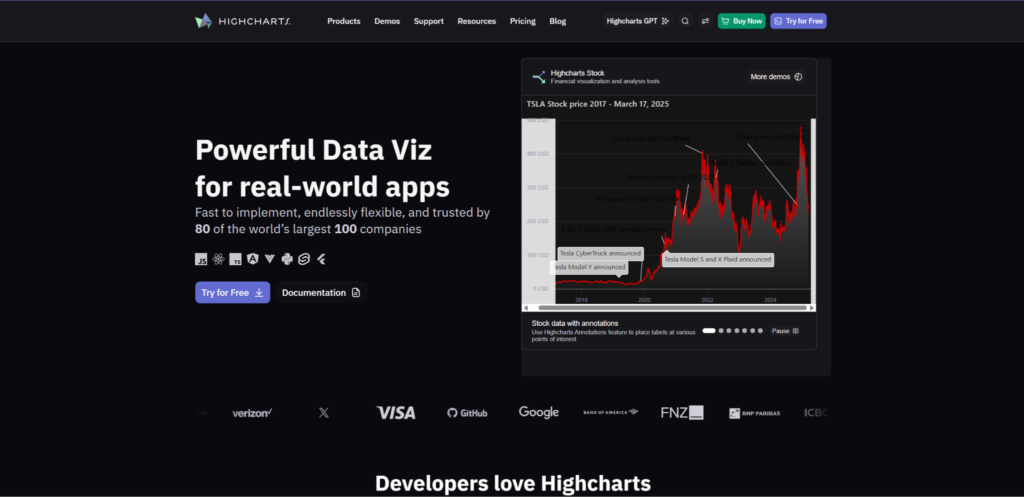
Highcharts has been around for a long time and remains one of the familiar names in web charting. Developers often use it for dashboards, reporting interfaces, analytics pages, and data-heavy business tools. It offers a polished experience without forcing teams to build charts from low-level primitives. The library is dependable, but it is not always the best fit for extreme data loads. Its strongest area is clean, stable charting for products that need reliable presentation and broad adoption.
Highcharts works well when a product needs many common chart types, a familiar API, and good documentation. It is often used in business intelligence dashboards, SaaS reporting, internal tools, and public-facing analytics pages. The library gives teams a proven route to interactive charts without too much custom engineering. Its main advantages are most visible in standard dashboard and reporting scenarios:
- Offers a wide selection of standard chart types for dashboards and reports;
- Provides polished default visuals that reduce design work for common use cases;
- Has detailed documentation and many implementation examples;
- Supports interactive features like tooltips, zooming, exporting, and drilldowns;
- Works for teams that value maturity, stability, and broad adoption.
Highcharts is a safe option when a product needs dependable charts without building too much from scratch. It is especially useful when the main goal is clean reporting rather than deeply custom visualization logic. Licensing should still be reviewed early, especially for commercial products.
Highcharts suits SaaS products, enterprise dashboards, finance reports, and analytics pages where chart quality and documentation matter. It is less ideal when the project needs unusual rendering behavior or very large interactive datasets. For those cases, a more specialized library may be a better match.
3. ECharts
ECharts is an open-source JavaScript visualization library with rich chart options, flexible configuration, and strong dashboard use cases.
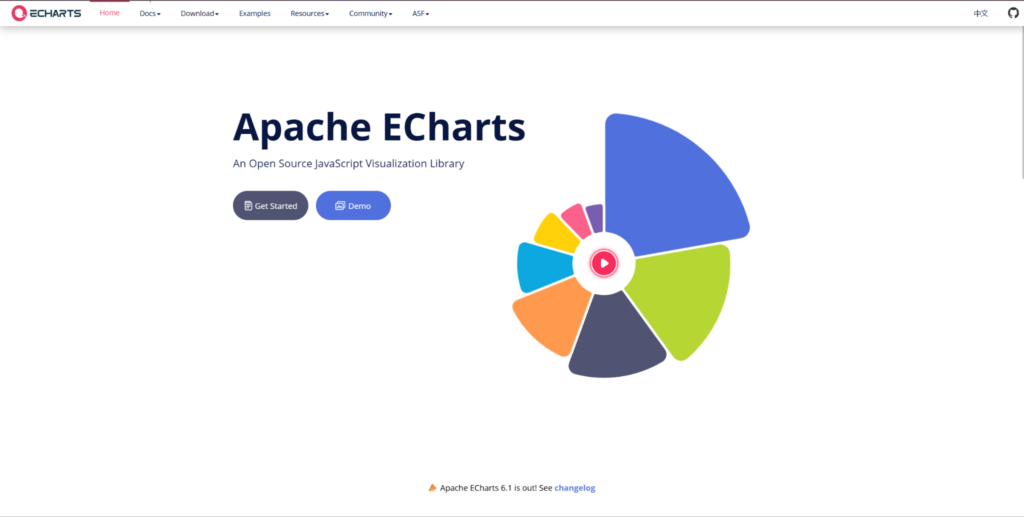
ECharts is a good option for developers who need more visual variety than basic chart libraries can offer. It can support dashboards, maps, analytics panels, and interactive data products. The library is often chosen when a product needs a broad visual toolkit without moving all the way down to low-level drawing logic. Its configuration-driven approach can speed up development once the team understands the model. The tradeoff is that larger setups can become configuration-heavy.
ECharts is useful when a project needs many chart types and a flexible setup process. It supports standard charts, geographic visualizations, heatmaps, and complex dashboard layouts. That makes it attractive for teams that want open-source access without giving up visual range. Its value comes from the combination of chart coverage, interactivity, and customization:
- Covers many chart types, including line, bar, scatter, map, heatmap, and tree-style visuals;
- Uses a configuration-based approach that helps developers build charts quickly;
- Supports dashboards that combine several visualization formats;
- Gives developers many styling and interaction options without going fully low-level;
- Offers an open-source path for projects that need broad chart coverage.
ECharts can be a practical choice when the front-end team has enough experience to manage configuration complexity. It is less minimal than some React-focused chart tools, but that extra setup can pay off when the dashboard needs variety. Real data testing still matters because not every heavy rendering case behaves the same in production.
ECharts suits analytics dashboards, admin panels, map-heavy products, and teams that want open-source flexibility. It is not always the cleanest option for small React components or highly specialized rendering needs. Its best use cases are projects where visual range matters more than a tiny API surface.
4. Plotly.js
Plotly.js is a JavaScript graphing library often used for analytical, scientific, and data exploration interfaces.
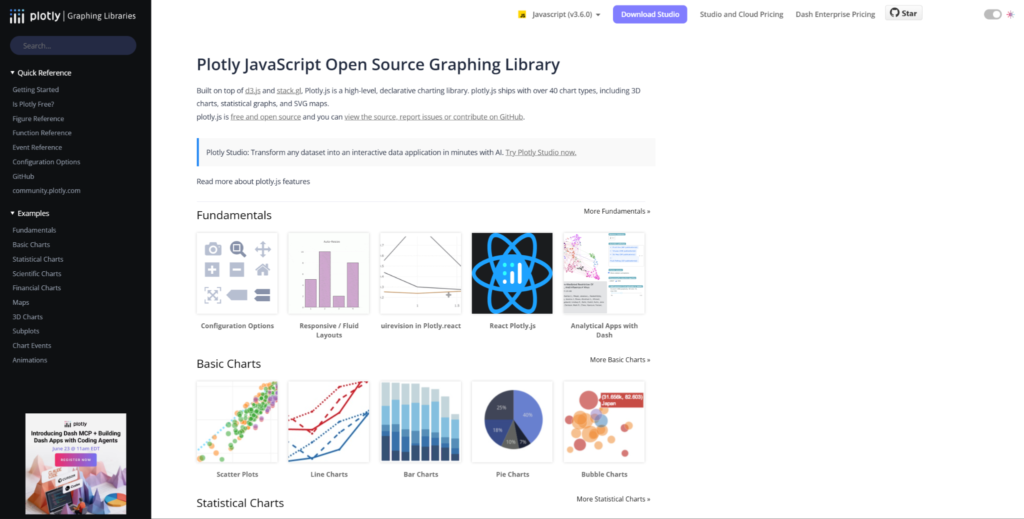
Plotly.js fits products that rely on technical charts, exploratory dashboards, and data-rich interfaces. It is popular in analytical and data science contexts because it supports chart types that go beyond standard business dashboards. Developers can use it for interactive visuals connected to complex datasets. That makes it useful for research tools, scientific software, and internal analysis platforms. It is not the lightest option for every front-end product, but it has clear value when graphing depth matters.
Plotly.js stands out because of its analytical orientation. It offers 3D charts, statistical charts, scientific plots, and interactive exploration features. This makes it different from libraries focused mainly on business dashboards or simple UI components. Developers usually consider Plotly.js when the product needs more than standard bar and line charts:
- Supports scientific, statistical, financial, 3D, and map-based visualizations;
- Works for analytical tools where users explore data interactively;
- Provides chart types useful for technical and research-driven products;
- Allows developers to build rich chart interactions without creating everything manually;
- Suits products that need graphing depth rather than simple dashboard widgets.
Plotly.js is useful when the product has a data science or research angle. At the same time, teams should check bundle size, rendering behavior, and fit with their front-end architecture. For simple SaaS dashboards, it may feel heavier than necessary.
Plotly.js suits scientific dashboards, technical analytics, educational tools, and internal data exploration products. It is less attractive for teams that need a lightweight UI chart component or very strict product styling. Its main advantage is depth, not minimalism.
5. CanvasJS
CanvasJS is a JavaScript charting library focused on fast setup, common chart types, and dashboard-friendly rendering.
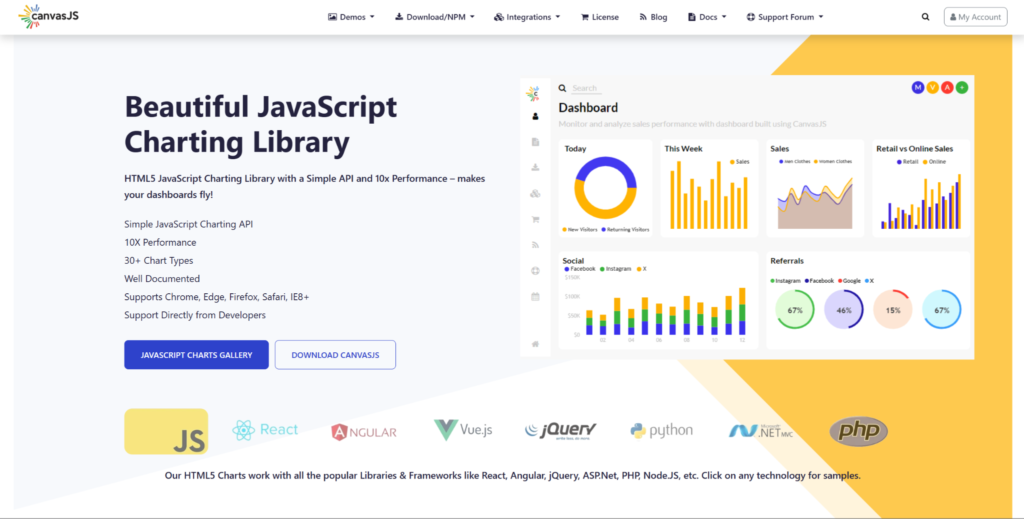
CanvasJS is a practical option for teams that want simple implementation and solid chart output without a heavy learning curve. It is commonly considered for business dashboards, admin interfaces, and reporting views. The library focuses more on accessible chart creation than on deeply custom visualization systems. That makes it easier to adopt in projects where charts matter, but are not the whole product. It is a straightforward commercial option for standard charting needs.
CanvasJS is useful when a team needs interactive charts quickly and does not want to build low-level visualization logic. It supports common chart formats and browser-based dashboard use cases. The library’s appeal is strongest when setup speed and familiar chart patterns matter more than unusual visuals. Its main strengths are tied to simplicity and predictable implementation:
- Supports common chart types used in business dashboards and reporting tools;
- Offers a straightforward API for quick implementation;
- Provides interactive chart behavior such as tooltips, zooming, and dynamic updates;
- Works for web applications where charts are important but not the entire product;
- Suits teams that want a commercial library with a simpler adoption path.
CanvasJS works best when the visualization needs are clear and not too unusual. It can be a good choice for teams that want less complexity than D3.js or Plotly.js. It may not be the strongest option for specialized scientific interfaces or extreme rendering requirements.
CanvasJS suits internal dashboards, SaaS reporting pages, admin products, and projects that need reliable standard charts. It is less suited to deeply custom visualization products. Its best role is helping teams add interactive charts without turning charting into a major engineering project.
6. AG Charts
AG Charts is a JavaScript charting library from the AG Grid ecosystem, aimed at teams building charts alongside complex data tables.
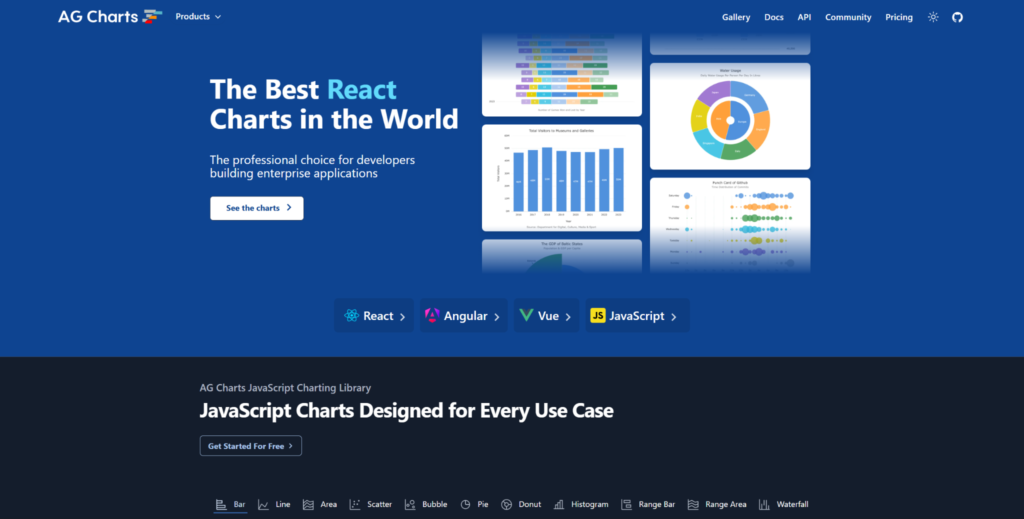
AG Charts is relevant for products that already deal with structured data interfaces. Many applications do not use charts in isolation: they combine charts with tables, filters, dashboards, and admin workflows. AG Charts fits that environment because it is designed for business-style data displays. It can be useful even for teams that are not already using AG Grid. The library makes the most sense when charting is part of a wider data UI.
AG Charts is built for clean implementation, typed development workflows, and common business visualization needs. It works across React, Angular, Vue, and plain JavaScript contexts. The library is not trying to be a scientific plotting tool or a low-level visualization framework. Its main value is helping teams add professional charts to structured application interfaces:
- Works in applications that combine charts, tables, filters, and reporting screens;
- Supports common business chart types with a clean implementation model;
- Fits teams that already use or evaluate tools from the AG Grid ecosystem;
- Provides a professional charting option for enterprise-style dashboards;
- Gives developers a practical route for adding charts to complex data interfaces.
AG Charts is a sensible choice when charts sit next to tables, filters, and reporting tools. It may not be the first option for rare chart types or deep custom drawing control. Its value is clearer in business applications than in scientific visualization tools.
AG Charts suits enterprise dashboards, admin platforms, internal tools, and products that rely heavily on tabular data. It is less suited to projects searching for the widest possible chart catalog or maximum low-level flexibility. Its best use case is structured data software where charts support broader workflows.
7. AnyChart
AnyChart is a JavaScript charting solution with a broad set of chart types for dashboards, reporting products, and data visualization pages.
AnyChart is a flexible option for teams that need many chart formats under one vendor. It can fit dashboards, BI-style pages, reports, and embedded analytics. The library’s main strength is coverage across different visualization needs rather than a narrow technical niche. That makes it useful when a product needs several chart styles, but the team does not want to combine many separate tools. It is a broad commercial toolkit rather than a lightweight chart component.
AnyChart can help teams avoid mixing several small chart libraries for different visual needs. Chart variety, export options, dashboard use cases, and documentation all matter in that type of setup. The library becomes more useful when the product roadmap includes several chart formats. Teams may consider AnyChart when they want one broad charting toolkit:
- Covers many standard and specialized chart types for reporting and dashboards;
- Supports interactive chart behavior for business and analytics interfaces;
- Helps keep several visualization needs inside one charting stack;
- Offers documentation and examples for common implementation scenarios;
- Suits products that need variety more than highly specialized rendering behavior.
AnyChart is useful when breadth matters and the team wants a commercial tool with many ready-made chart options. It is less compelling for teams that only need a few lightweight React charts. It also may not be the first choice for extreme browser rendering demands.
AnyChart suits BI dashboards, reporting systems, embedded analytics, and products with several chart formats. It is less ideal for very simple projects where a small open-source library would be enough. Its best role is helping teams cover many charting needs without building a fragmented stack.
How to Choose the Right JavaScript Chart Library
The best chart library depends on data volume, update frequency, user interactions, team skills, and budget. Choosing only by popularity can create problems later. A library that looks fine in a demo may lag or become hard to maintain in a real application. Licensing can also change the decision, especially for commercial products. Before choosing a library, test it against the conditions your product will actually face:
- Test the library with real dataset sizes, not only sample data;
- Check how charts behave during zooming, panning, filtering, and live updates;
- Review licensing early, especially for commercial products;
- Compare documentation, examples, framework support, and support options;
- Match the library’s visual range to the product roadmap, not only the first release.
Chart selection should be treated as a product architecture decision, not a small UI task. SciChart is strongest when heavy rendering and advanced visualization are central to the product. Other libraries may be a better fit for simpler dashboards, open-source-first teams, or projects with lighter charting needs.
Final Thoughts
JavaScript chart libraries differ heavily in what they are built to handle. SciChart stands out for demanding, data-heavy visualization where browser performance and advanced chart types matter. Highcharts, ECharts, Plotly.js, CanvasJS, AG Charts, and AnyChart each suit different needs, from business dashboards to scientific graphing and enterprise reporting. The right choice depends on real data volume, product requirements, budget, and maintenance plans. Test libraries in realistic conditions before committing, because demos rarely show the full picture.